Last month, GodsOfOdds published an article demonstrating how beating the closing line or the closing odds can be used as a measure of the skill of a betting tipster, and more specifically Pinnacle’s closing odds. The value in this metric hinges on those odds being a highly accurate reflection of the true odds for sporting contests. What the article didn’t address is exactly how accurate Pinnacle’s closing odds are, and how we can find out. This is the purpose of this latest article.
For nearly 20 years I have been collecting match betting odds for the major European domestic football divisions, and since the 2012/13 season they have included the closing odds from Pinnacle. With 57,986 football matches, and 173,958 different home/draw/away odds, this provided a sufficiently large sample to perform an analysis of the accuracy of Pinnacles closing prices.
Making Fair Odds
Firstly, we need to remove Pinnacle’s margin so that we have a set of fair odds. I have previously described one way this can be done which takes into account the favourite–longshot bias present in all football match betting odds. This method assumes that the margin weight applied to each of the three possible match outcomes is proportional to the size of the betting odds (or inversely proportional to the outcome probability).
Next, we need to verify these odds to be fair. One way to do this is to calculate the return we would achieve if we bet every single outcome with a unit stake. If the odds are fair, the expected returns would be 100%, or 0% profit. Obviously, there is randomness in football results, so even if we knew that our odds were fair, we wouldn’t necessarily expect to see 100%. Different histories would yield different outcomes. This randomness is called aleatory uncertainty. It is irreducible, but it can be quantified to reveal if our model for removing the margin lies within the margin of error. Let’s do this.
Betting all 173,958 outcomes with a 1-unit stake would have seen a return of 99.73% based on the results that happened. That’s a bit less than 100%, but is that difference statistically significant? I ran a Monte Carlo simulation with 1,000 randomised results histories by assuming that the outcome probability for each possible result was exactly implied by the fair betting odds I had calculated. The average return for these 1,000 histories was 100.01% (a larger simulation would have got even closer to the exact expected figure of 100%).
Sports are not like mathematical games of chance, however, and we can never actually know the true chances of any particular result since there are many variables which can influence them. Nevertheless, over samples of events, we can get a reasonable estimate of whether our odds were accurately reflecting the underlying outcome probabilities.
The crucial bit of data, however, is the standard deviation in those 1,000 histories, since this shows us the distribution of those possible histories, from which we can calculate how unlikely (or likely) our real history was. The standard deviation is a measure of how much spread there is in a set of data. This standard deviation here was 0.40%, meaning we would expect about 68% of possible histories to fall between 99.60% and 100.40% and about 95% to fall between 99.20% and 100.80%. Since our real history was 99.73%, this was well within one standard deviation of the expected average of 100%. Hence, we can be confident that our model for removing the margin is doing a pretty accurate job. We would only need to be concerned if our real history was beyond two or more standard deviations from 100%.
Before moving on, here’s a quick and neat little trick. If you want to know your distribution of possible betting histories, you can run a Monte Carlo simulation as described here to find the standard deviation in possible returns. However, a quick short cut is to calculate the standard error of the mean. To do this you just need two numbers: the standard deviation in your profits and losses (In Excel just use the function =STDEV), and the number of bets. Then divide the first by the square root of the second. In my sample history here, the standard deviation of profits and losses of those 173,958 bets was 1.670. Hence the standard error in the mean is 1.670 divided by the square root of 173,958 which equals 0.40%, exactly the same as the number my Monte Carlo simulation was used to calculate above. Knowing your distribution of possible histories is a good thing, since it will give you an idea of the possible range of good and bad luck than can affect your betting.
Are the Fair Odds True?
Now that we’ve determined our set of odds with the margin removed reflects the fair odds very well, we can investigate how accurate they are. That is to say, as well as being fair, are they also true? The true odds for a coin toss are 2.00 heads and 2.00 tails. For dice, the true odds for rolling any number is 6.00.
Sports are not like mathematical games of chance, however, and we can never actually know the true chances of any particular result since there are many variables which can influence them. Nevertheless, over samples of events, we can get a reasonable estimate of whether our odds were accurately reflecting the underlying outcome probabilities.
Suppose we have event outcomes where the odds are 2.00. If 5 out of 10 match the predicted outcome, this would imply that those odds were accurate, at least as an average across those 10 events. For sure, we cannot know how accurate each odds actually was because we cannot know the true outcome probability for each event. Taking averages is the best we can do. However, the smaller we can make these sample sizes and still maintain a good correlation between predicted and actual outcome percentages the more confident we can be the odds are accurate.
For my data I’ve decided to use a sample resolution of 1% predicted outcome probability. We can calculate the predicted outcome probabilities simply by inverting all of the fair odds. Having done this, we just calculate how many outcomes actually occurred for each of those samples and convert to an actual win percentage. Finally, we can plot those data points on a chart. For my data, this is what that looks like.
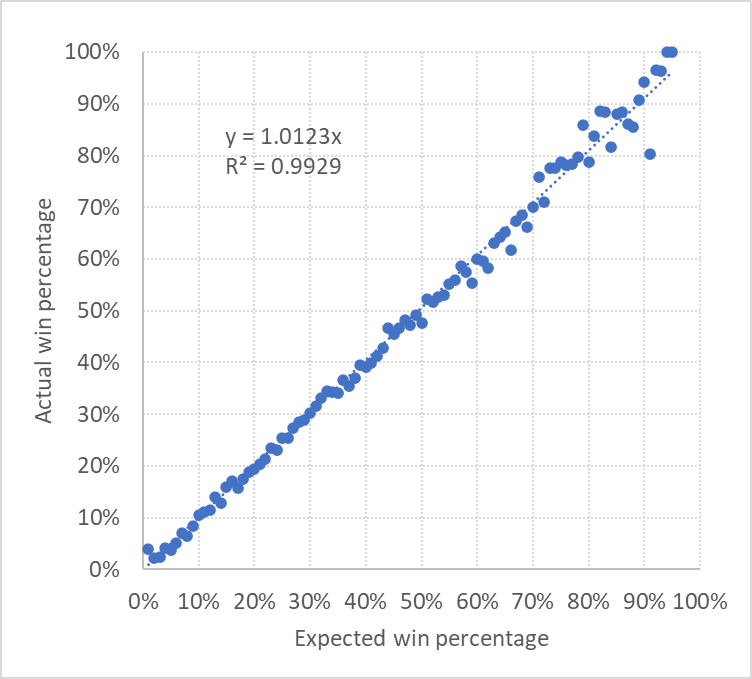
You can see there is a very strong, almost 1-to-1 correlation between the predicted outcome probability and the actual outcome percentages. Outcomes that are expected 25% or 75% of the time do actually occur about 25% or 75% the time. The same is broadly true for the full range of betting odds.
I could plot this data for Pinnacle’s opening odds, or bet365 opening odds or Oddsportal’s average odds and we would see remarkably similar charts to this one. All of them would imply that all their odds are very accurate at this 1% outcome probability resolution. So, what’s special about Pinnacle’s closing odds?
What’s Special about Pinnacle?
Pinnacle operate a bookmaker model that is different to all others. They operate a high-turnover, low-margin model, which allows sharp bettors with positive expected value to win without being restricted. In contrast, UK and European bookmakers cater only for the recreational bettors, offering a wider variety of markets with more novelty bets but restricting those who have a genuine edge.
Pinnacle’s low-margin model means that they have to be sharper than other bookmakers, otherwise there will be too many winning customers eating into their profits. However, because Pinnacle adjusts their odds more dynamically in response to the sharpest bettors more than other bookmakers, their odds become more accurate more quickly relative to their competition. Not only does this ensure the number of winners is kept to a minimum, but also by market closing they are likely to have the most accurate odds. How can we see this?
The best measure of value is the advantage you hold over the true odds. For example, if the true odds are 2.00 and your bookmaker is giving you 2.10, you have found an expected value of 5%. Obviously, the randomness in results means you won’t always win these 50-50 bets. But over large numbers of bets you can expect to win 50% of them. Suppose over 1,000 1-unit bets, you win 500 of them. The winning bets return 1,050 units minus the 500 stakes for a 550 profit, whilst the losing bets lose you 500 units. The net profit is 50, or 5% of your 1,000-unit turnover.
The short cut calculation to find your expected return is the bookmaker’s odds of 2.10 divided by the true odds of 2.00. 2.10 divided by 2.00 = 1.05, implying your expected return is 105% and your expected profit is 5%.
The Pinnacle True Odds Hypothesis
Let’s make a hypothesis: Pinnacle’s closing odds with the margin removed are equal to the true odds. If this is so, then any price divided by Pinnacle’s fair closing price should give us a measure of the expected value of those odds. Then, if the size of the expected value correlates very closely with the size of the actual returns you would have made if you could have bet those prices, that is strong evidence confirming the validity of the hypothesis.
For every Pinnacle closing price in my data set, I also have a pre-closing one, collected for Football-Data’s fixtures before the matches have been played. Consequently, having removed the margin from those prices in the same way I did for the closing prices, I can calculate a pre-closing to closing price ratio for every bet. Then, using the actual results I can see how expected value as predicted by my hypothesis (that Pinnacle’s fair closing prices are true prices) compares to actual returns from hypothetically betting the fair (margin removed) pre-closing prices as governed by the real results. This is shown in the first chart below.
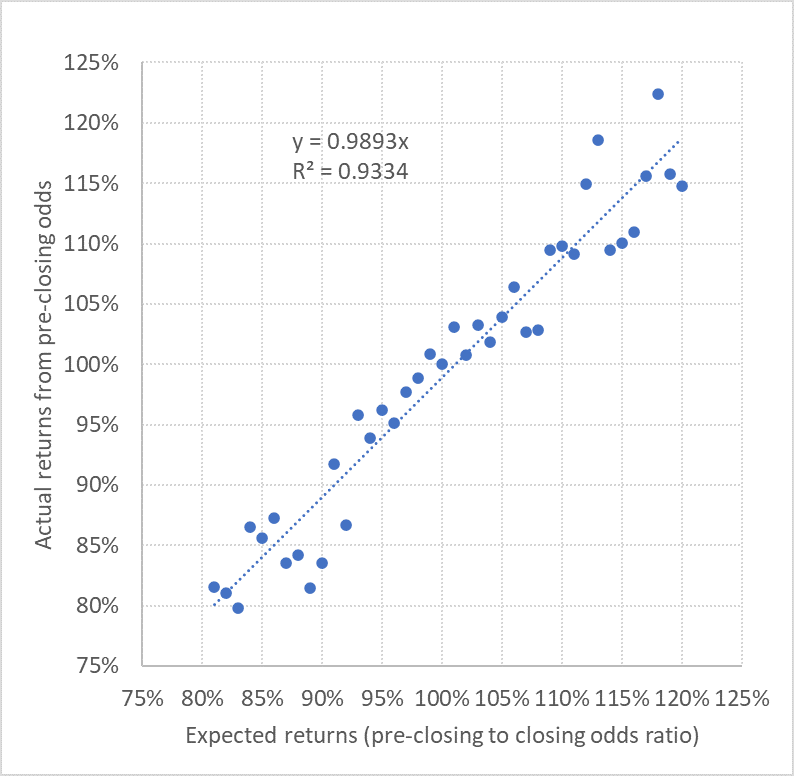
You can see there is a strong, and almost 1-to-1 correlation confirming that my hypothesis is likely to be valid. When the pre-closing to closing price ratio is 95%, we see 95% returns on average. When it’s 105% we see 105% returns on average.
Obviously, as for our search for price accuracy earlier, I am not saying every closing price will be perfectly true, just that on average this appears to be the case. Any errors made by Pinnacle in this respect are likely to be largely random in nature and cancel out over samples of odds, as this chart illustrates.
Now take a look at the next chart. This reverses the hypothesis. Now I am testing whether it’s the pre-closing prices that provide the more accurate model for odds truth, using the closing price to pre-closing price ratio as a measure of expected value and calculating the returns we would see from betting the closing prices (always with the margins removed).
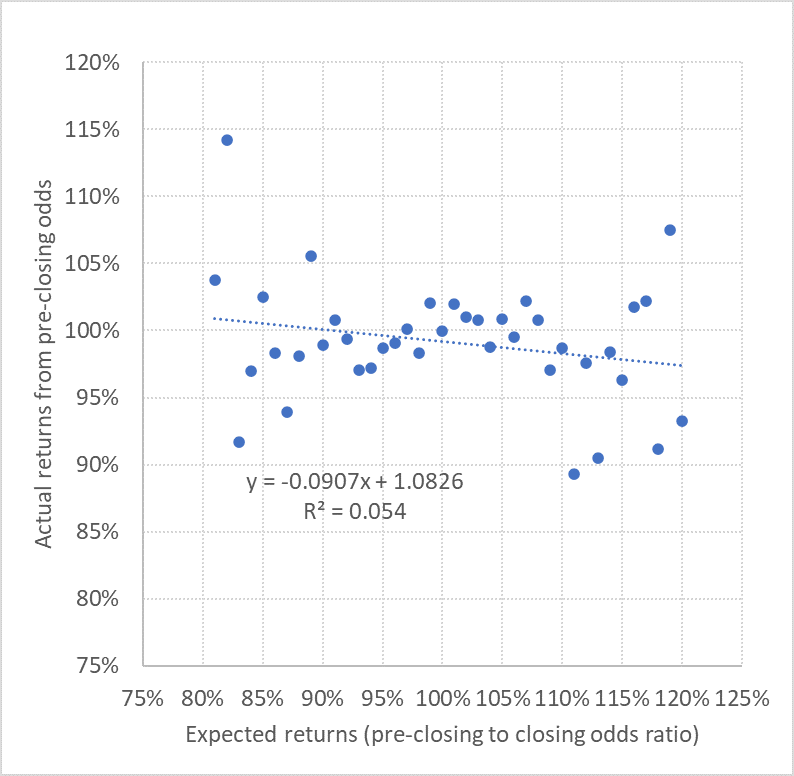
This time there is effectively no meaningful correlation at all. Relative to the closing price, my pre-closing prices contain very little useful information about the truth of outcome probabilities. Of course, that is not to say they don’t contain any information at all, it’s just that what information they do hold is also contained in the closing prices; they don’t offer anything additional.
Relative to other bookmakers’ pre-closing prices, however, Pinnacle’s pre-closing prices DO contain a lot of information, and they are far more accurate. Indeed, it is precisely this knowledge which allows me to exploit the weaker prices of those other bookmakers with my Wisdom of the Crowd betting system, but talk of this is perhaps for another time.


0 comments
Please login to write comments
Login