With the application of data becoming more and more prevalent in today's game, the use of Expected Goals (xG) in football has been right near the top of the list in terms of exposure.
Coming under the category of advanced metrics, xG rates a shot’s probability of resulting in a goal by a figure between zero and one. When it comes to calculating the xG of a particular shot, there are many things that are taken into consideration.
To start with, the location of the shot and what angle it was struck from are crucial. Close-range efforts from directly in front of goal will obviously record a high rating, whereas long-range efforts and shots from tight angles will not. Shots that are hit by foot will typically generate a higher xG than ones with the head, shoulder, thigh or knee because of the increased control, accuracy and power that can be generated with the foot.
How the shot came about is also key, for the reading can vary if it is following a rebound, a set-piece, a cross, a through-ball or after a piece of dribbling has been undertaken by the shooter. Some advanced models also take the position of the goalkeeper and defenders into account, although the fact that is not yet widespread hints at a potential shortcoming of xG.
A shot with an xG of 0.8 would be expected to be scored on eight out of 10 occasions. Interestingly, seeing as penalties are scored 76% of the time on average, spot-kicks therefore have an xG of 0.76. In addition, rebounds from a penalty where the goalkeeper is out of the equation have an average reading of 0.72.
It should be noted that xG does not factor in the quality of the individual players involved in the move or eventual shot; it instead deals with averages depending on the conditions the shot was taken under. This is why the world’s top strikers regularly over-perform their xG. Expected Goals is consequently an excellent tool to measure how good or bad a team or player is at converting their chances.
This analytical tool does not just assess individual players but also collective teams. When we compare xG and xGA (Expected Goals Against) to actual goals scored and conceded, we can identify which teams are over-performing and which are under-performing. However, there are numerous reasons why a team’s xG can differ from their actual results. In the short-term, luck plays a huge role. That is why xG is best applied over a period of at least seven games, when we can get a clearer picture of what is actually going on.
Expected Points (xPts) is another element that warrants covering. Most models calculate this by working out the probability of a team winning a game based on the xG data of both teams involved. Different models employ different figures, but we would expect an xG differential (the difference between a team’s xG and xGA) of more than 1.5 to result in xPTS of around 2.5. So, if Liverpool record an xG of 3 and Bournemouth register an xG of 1.5, most xPTS model would give the Reds around 2.5 xPTS. From this data, we can create an xPTS league table and compare this to the real-world standings.
Particularly handy in league table betting and projecting where teams will finish, this tool can certainly allow you to profit if teams perform to expectations. Furthermore, trends can be spotted here if a team is punching above their weight or falling short, thus enabling you to tailor your selections accordingly.
Although xG is usually fairly accurate over large timeframes, sometimes outliers can occur and teams can consistently under- or over-perform their statistics. Some useful examples from this campaign on an individual and collective level come from Sheffield United forward, David McGoldrick, and Liverpool.
We will start with McGoldrick. His case is fascinating, as he is yet to score a Premier League goal even though he has unleashed many good shots: his efforts add up to an xG of 6.6 from 34 shots (of which 50% have been on target) in Premier League action, which demonstrates that he has either fallen victim to bad luck or superb goalkeeping, or that his finishing has been wayward.
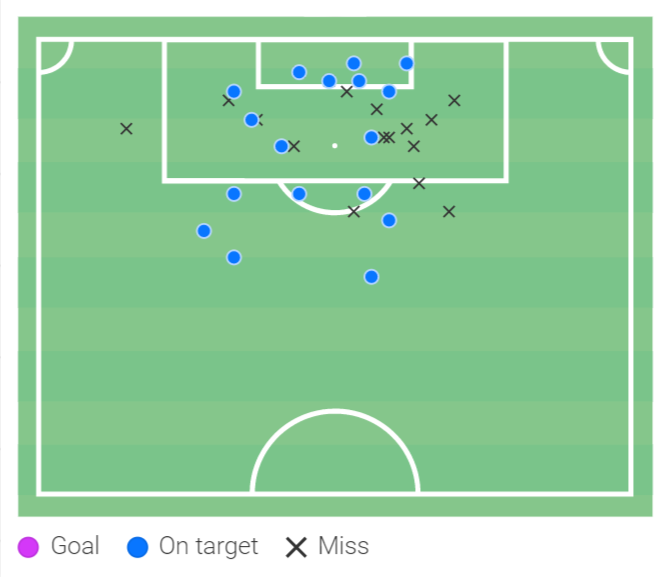 McGoldrick's Shot Map
Liverpool are at the opposite end of the spectrum, as they have scored 66 goals from an xG of 57.60, which has largely been credited to some top finishing, a dash of luck and their efficiency from set-pieces. The graphics below provide examples of both how the Reds have outgunned their xG.
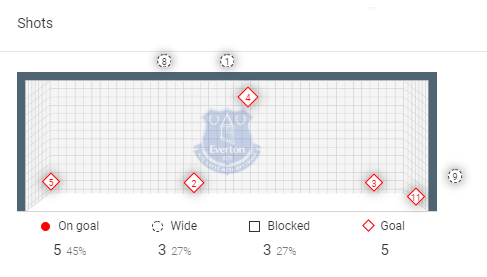
Liverpool's Map from their 5-2 win over Everton where they only recorded an XG of 1.87
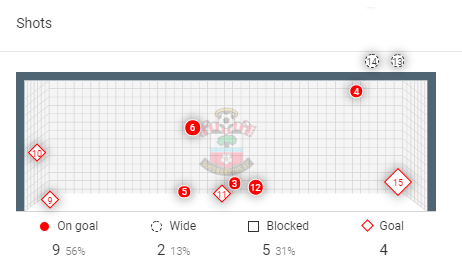
Liverpool's Map from their 4-0 win over Southampton where they recorded an XG of 3.62
An interesting comparison can be found in Manchester City, who are pretty much right on where you would expect them to be. They have bagged 68 goals from an xG of 68.37. The fact City spent periods of this campaign out-performing their xG illustrates how things usually revert to what is expected.
In relation to betting, xG is an excellent tool. The key towards its implementation is using it over longer time periods so you can get a better gauge of how a team is playing and how well they perform against opponents who play in a particular style.
Even if it is not entirely accurate all the time, xG is still a superb tool for gauging a team's form and how you might expect them to perform in the future. It should keep improving too, as models continue to grow more sophisticated.
Comparing xG to real-life results can help bettors identify value picks. This can be especially beneficial when a team is on a poor run of results but their xG numbers are positives. Some betting sites might not recognise such trends, allowing you to exploit favourable odds which will pay off if the team’s results eventually match their underlying figures. Your chances of gaining an edge on markets such as both teams to score and over/under can be increased too.
While xG is a useful tool, it is far from perfect. Many excellent teams and strikers regularly over-perform their xG because they are simply better finishers than the average player. What is more, certain sides have a historic tendency to either under- or over-perform with xG. Lucien Favre, currently in charge of Borussia Dortmund, is a good example. Favre has consistently beaten his team’s xG at Borussia Monchengladbach, Nice and now Dortmund, which shows that xG numbers are not the be-all and end-all.
An example from the Premier League is Burnley, who have often over-performed their xGA under Sean Dyche. This is thought to be because of the number of players the Clarets pack between the shooter and the goal. This does not show up in most xG models, which assign a value to each shot based largely on location. The fact that Burnley players regularly blocked the shots they faced did not show up in the data.
Even if it is not entirely accurate all the time, xG is still a superb tool for gauging a team's form and how you might expect them to perform in the future. It should keep improving too, as models continue to grow more sophisticated. If you want to read more about xG and betting, we recommend this expected goals guide.
All in all, xG, xGA and xPTS are valuable resources that add an extra dimension to the football landscape. The tools benefit professional club analysts, managers, scouts, television pundits, casual fans – and, if used widely, sports bettors.
All xG data is from Wyscout.


0 comments
Please login to write comments
Login